
Google Analytics 4 (GA4) is the new wave for website and app analytics tracking for your business, and it will soon replace Universal Analytics (UA) altogether. In this article, we’ll go through what’s changing, and the keys to using GA4 for all it’s worth.
What are the Main Differences and Advantages of GA4?
If you have been using Universal Analytics to track engagement on your website, you will notice some very important differences to the GA4 interface right away. The left column navigation for GA4 is simplified quite a bit, leading users to wonder if all of the same reports are available between the two versions. The short answer is, no.
Yet, GA4 is still an incredibly powerful tool for analytics tracking. In fact, it may be more useful overall. In many ways, it allows for greater customizations to track more relevant data and pull deeper insights according to your specific business needs. Let’s look at how GA4 gathers, measures, and processes data differently than Universal Analytics, and how the new platform is better adapted to scale with businesses globally in years to come.
How Has Data Collection Changed in GA4?
Cross-Platform Tracking in GA4
The biggest difference between GA4 and Universal Analytics is where user data comes from. Previously, if your business had an app or multiple apps, along with a website, tracking interactions within these platforms was done separately, through Universal Analytics for your website and Firebase for your app.
Now, GA4 combines data from all of your online platforms. You can compare website and app interactions side-by-side, and see total user engagement across all platforms.
When setting up your GA4 property for cross-platform tracking, you would input the separate data streams via gtag.js or Google Tag Manager for your website or sites, and Firebase for your apps. Then, all applicable data streams will feed into the same property to be used in reports and explorations together. This greatly simplifies tracking across platforms available to users and offers you a full picture on how people are really engaging between your website and apps. For instance, if a user signs in on your website but then navigates to the app to shop and finally checkout, you would be able to view this customer journey and in turn gain key insights on how to optimize either platform based on how they’re being used.

User Identities in GA4
A major reason for the remodel from Universal Analytics to GA4 are tightening restrictions on privacy laws, and regulations over the collection and use of personally identifiable information and data. The EU’s data protection law, the General Data Protection Regulation (GDPR), went into effect in 2018, along with global legislation intended to protect online users from the collection and improper usage of private data. Over the last several years, cookie tracking, third-party data collection, and unnecessary storage of data collected from individuals using apps or the internet has been restricted across the majority of nations worldwide.
The way GA4 collects and stores user data was modified from UA to better comply with global regulations and shifting customer expectations about how their online data should be used. Data intake now comes standard with default anonymization, which cannot be disabled. Data storage for explorations is limited to a 14-month maximum. This may feel restrictive, but an expansion of identifiers allows for a deeper picture of a user’s total journey from the data collected, which is a huge benefit overall.
GA4 utilizes three different user identifiers:
- User ID: Assigned to a user who has created an account with your business and can login directly to your website or app. This information must be supplied to GA4 for the platform to pull data based on user activity.
- Google Signals: Occurs when a user is signed into and using Google to access your business’s website and allows tracking by Google for personalization.
- Device ID: A user’s IP address as recognized by the browser in use, or an App Instance ID for users who have opened your app. This is now anonymized by default in GA4 without the option to change settings. The platform will not store full IP addresses at all.
Depending on how you’ve set your preferences, GA4 will scan user data for the above identifiers, recording the highest-tier ID possible to determine how a user has interacted with your app or website before. This data collection model allows GA4 to paint a better picture of how users interact with your business online from different devices and between the separate platforms available.
The data is presented in aggregate form within automated reports, so you are able to access comparisons there for as long as you are tracking data in GA4. However, user-level data retention is limited to 2 months or 14 months, depending on how you use analytics. This limits the amount of time GA4 will store data that can potentially be personally identifiable. This is more in line with the GDPR standards and the trend towards tighter restrictions on personal data collection that will likely only get stricter worldwide over time.
How Has Reporting Changed in GA4?
GA4 does not offer the same reports you would see in Universal Analytics. In addition, the functionality of the available reports are different. Where did the reports go, and how do you duplicate findings from Universal Analytics in GA4?
Event-Based vs. Sessions-Based Data Measurement
The reports are different between the two platforms because they use entirely different models for data measurement. Whereas Universal Analytics recorded user interactions in terms of sessions, every interaction with your site or app in GA4 is recorded as an event. Each time a user lands on your site or opens your app, that triggers a session_start event. If the user is new to your site overall, this is a first_visit event. If the user clicks on a link within your site, this is a click event, and so on.
Sessions-Based Logic
Sessions-based logic, like that of Universal Analytics, is built around grouping user interactivity within 30 minute sessions once they’ve arrived at your site. Each time someone lands on the site, a session is started and any “hits” they perform—clicks, page-views, form-fills, purchases etc.—are lumped into activity for that single session. However, this model doesn’t always provide a good picture of what the users really do once they have arrived, or how their interaction could be spread over multiple visits.
For instance, if a user lands on a blog page, but does not move to a second page within the site or trigger another “hit” by clicking on an element within the page, the entire session would be recorded as a bounce, even if a user stayed on the page for several minutes or scrolled through, indicating that they likely read the page in entirety. Or, let’s say a user has a session active, but they accidentally close the browser tab and end up navigating back to the site from a different campaign source. Sessions-based logic like Universal Analytics will close the first session and track the new visit as a separate session altogether, which can result in a fragmented view of that user’s overall engagement.
Event-Based Logic
The use of event-based analytics in GA4 shifts the focus onto how each user interacts within your website as they trigger separate events, such as scrolling to the end of a page, bringing up a form multiple times or even returning to engage from separate campaigns or even multiple platforms. This provides a more in-depth view into user behavior overall. Event-based logic allows businesses to determine what actions or behaviors are most important for their users to take, and analyzes activity around those specific events. This delivers a more flexible and customizable approach to analytics, and allows you to easily shift your analytic focus as the goals of your business change or grow.
How to Switch From Sessions to Events
So, with a complete shift in data measurement, how do you find the information you had been using to determine user activity before?
Well, sessions still exist in GA4—they’re just measured differently. You can still gather reports based on a number of sessions, view total users or new users, or see how many views a certain page gets. However, GA4 allows you to define what details of each event matter most to your business, and then create reports based on those events compared across key dimensions.
See, in GA4, each event a user triggers includes specific details, recorded as event parameters. Certain parameters like page_title, language, page_location, page_referrer and screen_resolution are automatically included for standard events. You can also add parameters as needed to create a fuller picture based on what you need to see from your users. You can even add custom events with custom parameters to get more specific details as needed. Event parameters then correspond to different dimensions and metrics that you can compare in your GA4 reports.
This does not mean that applying the right set of comparisons to standard reports in GA4 will pull the same data that you would in Universal Analytics. In large part, the data will not be the same, due to the very different model of data collection and processing. In most cases, even if you were able to closely align GA4 comparisons to UA filters within reports to pull similar information, the differences in data reporting and in setup at account and property-level settings between the two platforms makes it nearly impossible to get the same numbers between the two systems.
How to Sort Important Events
Goals, as previously set up in Universal Analytics, have been completely reworked in GA4. Instead of setting goals based on arrival to a specific URL, GA4 counts conversions based on important actions a user can take within your site or app, based on the events you are tracking. See an example from the demo GA4 Google Merchandise Store Property here:
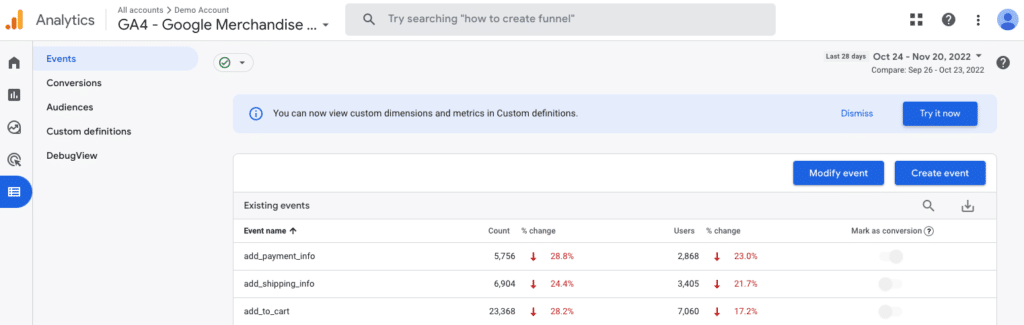
You set conversions by simply toggling “Mark as Conversion” in the far right tab for any particular event within the Events and Conversions tab, under Data Streams and Property Settings*. Once an event is marked as a conversion, you can navigate down to “Conversions” and see activity from those specific events on their own. GA4 will list each conversion with a count and value shown for each, based on your chosen date range or date range comparison.
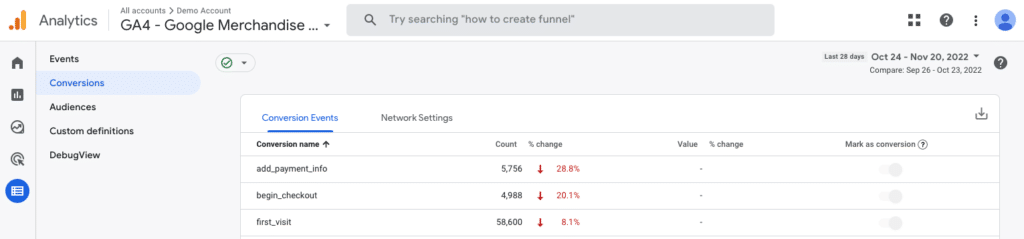
Within this new model, any interaction can be considered a conversion, depending on what you consider to be most important to your business and you can quickly and easily view conversion counts and changes in one place.
It may seem difficult to navigate reports within the new system, given the drastic changes to how data is collected and what reporting options and configurations are now available. However, the event-based reporting of GA4 is more flexible than the session-based model of its predecessors. If you take the time to learn the new platform and set up your property based on the dimensions and metrics that are most important to your business, you may eventually find it easier to glean useful information and uncover deeper insights overall.
Top GA4 Features to Begin Using Now
Utilize the Power of AI Predictive Data with GA4 Insights
One of the key features embedded into GA4 is advanced automation and machine learning technology. This is constantly applied to incoming data and automatically generating key insights based on what it senses is most important for your business. Insights and recommendations are populated within the Home dashboard and several places throughout the Reports and Advertising sections.
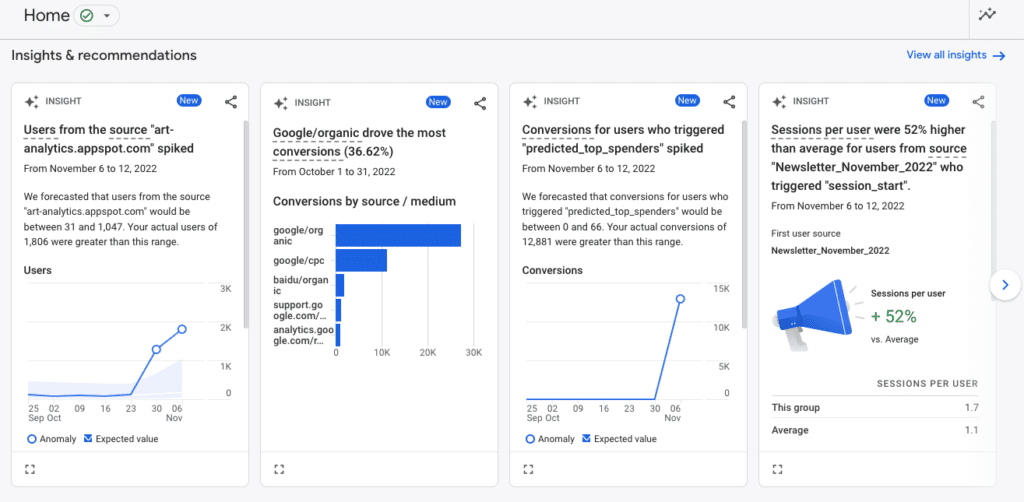
From the demo GA4 Google Merchandise Store Property
Use these insights to monitor results from user interactions that you may not have uncovered through your own comparisons, and expand the full report linked at the bottom of the insight card to view the full report.
GA4 Explorations for Deep Drill-down Reporting
Automatically generated reports offer similar high-level information as some of the overview reports in Universal Analytics. You can add comparisons to get a little deeper into things within the canned reports, but not like you were able to with filters in UA. However, GA4 offers a new set of reporting tools that offer very deep drilldowns, previously clunky or unavailable in the general Analytics toolset: Explorations.
With the upgraded tools in the GA4 Explore section, you can create customized, detailed reports based on the metrics, dimensions, and user segments that are important to your business. You can start from scratch, or begin with one of the six pre-populated templates and customize from there.
Here is a quick overview of the Exploration templates available with example models from the demo, GA4 Google Merchandise Store Property:
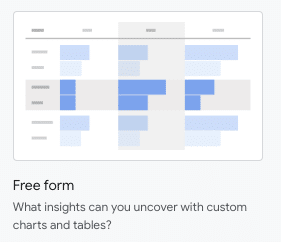 |
Free Form Exploration Free form allows you to pull key dimensions and metrics together, and apply user segments as needed. You can then view the data in a detailed table chart, pie chart, line graph, scatterplot or over a map, depending on the data you’re analyzing. |
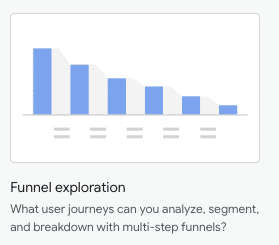 |
Funnel Exploration With Funnel Exploration, you can define up to 10 steps within an open or closed process funnel, and then map dimensions and segments over the funnel. This will help you discover how different sets of users are moving through the process and identify any steps that could be optimized for better engagement with those users.You can view the data as a standard funnel or as a trended funnel to identify whether time may be a factor in how users are moving through the process. |
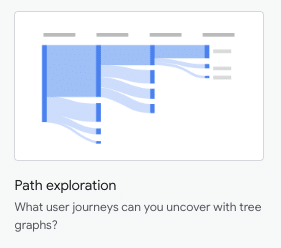 |
Path Exploration The Path Exploration template is pre-populated to display how users navigate after the session_start event. Each event is displayed as a node and you can follow an individual path, revealing and then closing steps by clicking on each node.To set a specific start or end point for the path exploration, click “start over” at the top of the report window and then customize as needed. |
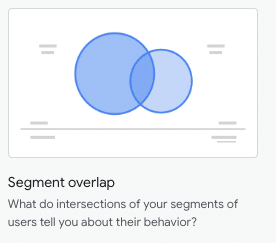 |
Segment Overlap The Segment Overlap template is again pre-populated upon opening. You can add, remove or exchange segments to display up to three segments against each other with values between these groups listed individually and as they overlap below. |
 |
Cohort Exploration In the Cohort Exploration you can set inclusion and return criteria to see user “membership” to a cohort based on behavior over time.You can further expand the trends in cohort groups by adding a breakdown to see how the trends apply based on specified dimensions. You can also view standard, rolling or cumulative numbers of users over daily, weekly, or monthly granularity. |
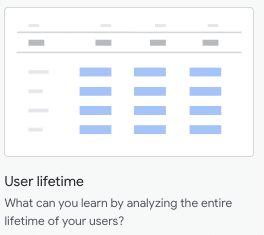 |
User Lifetime User Lifetime populates total users and their average lifetime value, engagement, and transactions into the columns of a basic table, with cell options of a bar graph, heat map or plain text. You can apply different dimensions to the rows. |
 |
User Explorer The User Explorer report can help you analyze data from a segment of users who fit specific criteria, or even individual users by anonymized id, to uncover key data about the use of your site and individual user behavior. You can also arrive at a user exploration report from other exploration views. If you have uncovered a new segment of users to explore within, say, a cohort exploration or segment overlap, simply right click on the group you would like to investigate and select “view users.” This action will open up an explore report with those particular users in a separate tab, filtered by a temporary segment based on your findings. |
Each of these exploration report templates are pre-populated with best-use metrics, dimensions, user groups, values, etc., but are completely customizable. You can also duplicate reports and apply changes for comparison, or create different reports altogether to view in tabs side-by-side. Once you have designed a meaningful custom report within Explorations, you can save that report for future use or even share it with others who have access to the property or account.
GA4 Realtime and Debug view
Realtime exists within Universal Analytics, but displays user activity over the last 5 minutes and requires users to navigate through a menu of options to see different key information pulled from recent visitor activity. The updated Realtime reporting in GA4 is simplified into one dashboard with key report cards pulled from user activity over a longer 30-minute period. Aside from being more attractive and more user-friendly overall, Realtime in GA4 can be a great tool to track user reactions to new content.
GA4 also added one extra special feature to their Realtime reporting: User Snapshot. Within the User Snapshot view, you can see a random user’s activity in real time as they navigate through your site and open each event to inspect the parameters within.
The Debug View within the Configure section is very similar to the User Snapshot view. In this view, you can quickly and easily test custom added events, or check that your parameters are set correctly by triggering and then inspecting the event within Debug View in real time. This is a very handy tool for developers to make sure campaign triggers, events, and parameters are set up correctly and that the data you’re tracking will deliver the correct information without a time delay.
Updated Search Functions in GA4 Aid Learning and Discovery
If all of the above information on GA4 seems a bit overwhelming, the new GA4 Search Box may just help calm your worries. It’s been completely reworked and improved compared to the Search in Universal Analytics. It offers instant insights, or it can direct you right to the reports or information you are looking for.
Looking to find “total users this month compared to last month,” and not sure where to find that information in GA4? Type your request right into the Search Box and GA4 will likely have an answer for you right there. You’ll also be able to quickly view the full report where that information can be found.
In addition to these handy features, simply tapping the search bar will display a list of recently viewed reports, so you can quickly navigate back to the information you found yesterday. It can also send you to the best article within Google’s Analytics Help pages if you need more information in general.
Ongoing Changes to GA4
Like many Google products, GA4 is an ongoing development. You may find that some functions are located in different areas than those described in this post. Or, you may find additional functions that are not described. As these changes develop, we will periodically update this post. However, you may find some differences in the current view you’re using.
If you haven’t made the transition to GA4 from UA yet, now is the time. As of July 1, 2023, UA will no longer gather data. In the coming years, Google will stop supporting UA altogether. Learning to navigate GA4 and maximizing its potential as an analytics tool may take some time, but the data insights available to you are worth it. If you’re not sure how to navigate this change, or if you’d like to learn more about how to use web analytics to improve your website and digital marketing strategy, join our webinar. Our digital marketing experts can help you align your data-gathering tools with your business goals.
