Google Sheets is one of my favorite web applications. It’s quick, lightweight, and easy to use. For those of you not familiar with Google Sheets, it’s Google’s web-based spreadsheet application. While creating tabular data is the main function of this application, did you know that you can also create dynamic, embeddable charts based on these data values? Let’s take a look.
Creating a spreadsheet in Google Sheets
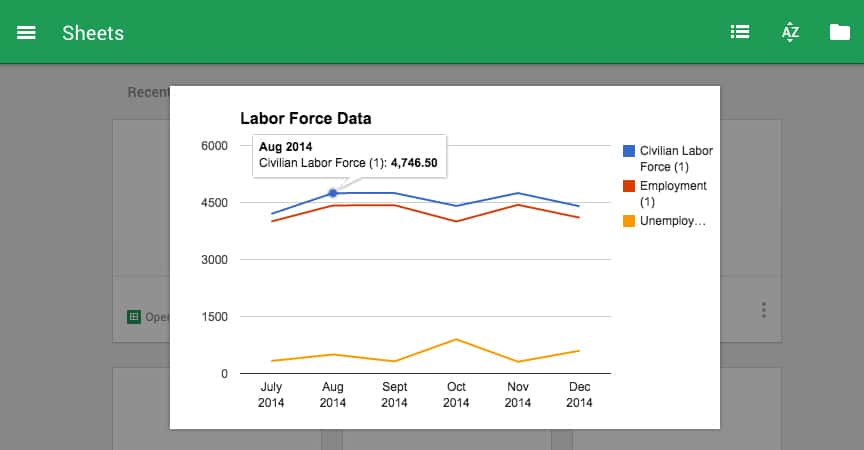
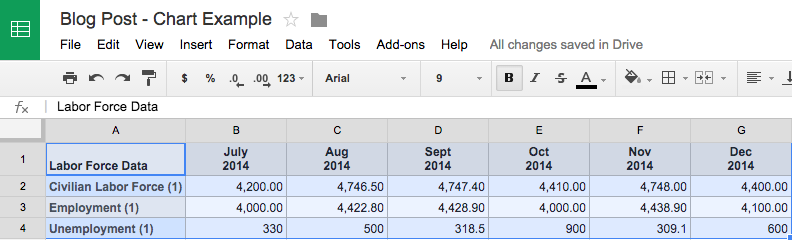
Hopefully, if you’ve worked with Excel or any other spreadsheet program entering data and creating tables is nothing new. Typically, your table might contain row and/or column headers and data cells. Let’s look at this example table:
|
Labor Force Data |
July 2014 |
Aug 2014 |
Sept 2014 |
Oct 2014 |
Nov 2014 |
Dec 2014 |
|---|---|---|---|---|---|---|
|
Civilian Labor Force (1) |
4,746.10 |
4,746.50 |
4,747.40 |
4,410.00 |
4,748.00 |
4,400.00 |
|
Employment (1) |
4,416.10 |
4,422.80 |
4,428.90 |
4,000.00 |
4,438.90 |
4,100.00 |
|
Unemployment (1) |
330 |
500 |
318.5 |
900 |
309.1 |
600 |
|
(1) In Thousands |
Generating the chart
Generating a chart based on your table requires a few simple steps:
Select the rows and columns you would like included in your chart
Click the chart icon in the header of Google Sheets

Select which chart type you would like to use (Google will recommend several chart types based on your selected data but if you don’t see your type listed click the More ›› link)
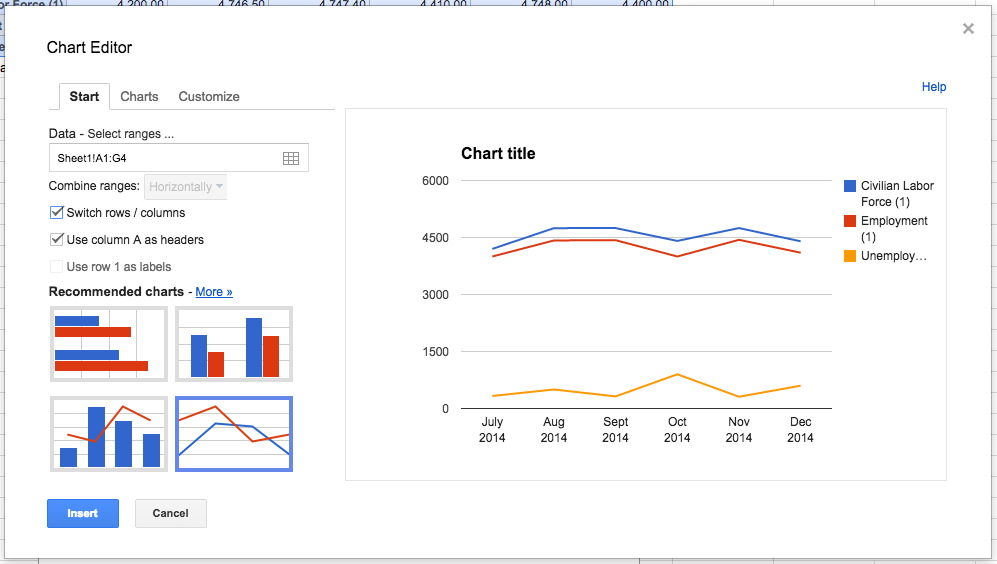
In some cases you will also need to tick the option “Switch rows / columns” and/or “Use row 1 as headers”.
Click the Insert button to add the chart to your sheet.
If the chart still doesn’t look right, you can modify the settings by right-clicking the chart and selecting Advance Edit.
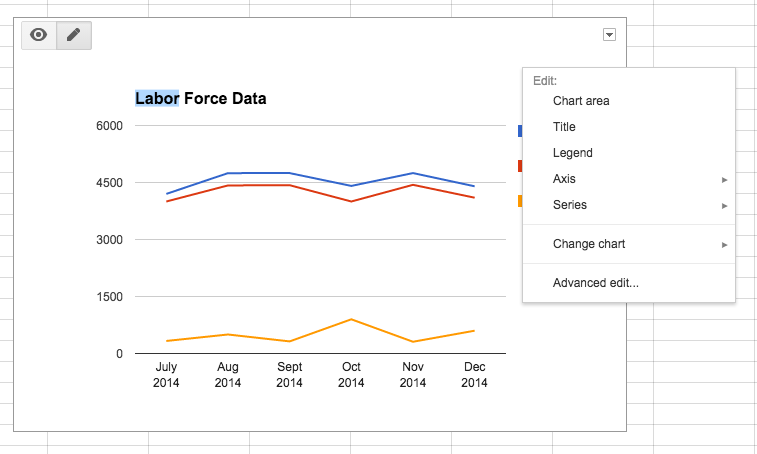
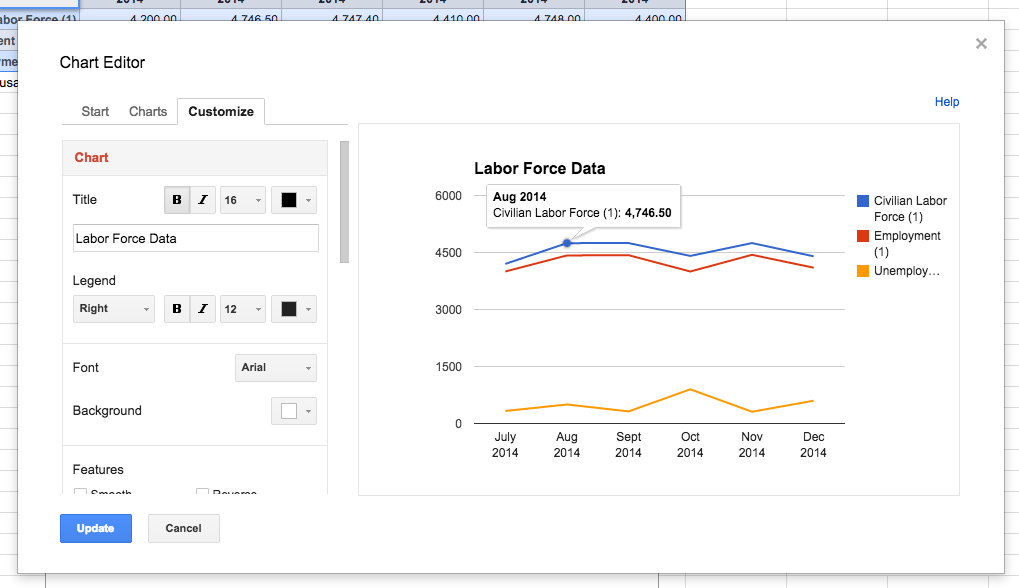
Customizing the chart
Customizing your chart is a very easy task in Google Sheets. Let’s say you want to change the colors of the chart, the font size, or swap the axis, simply right-click the chart, select Advance Edit and click on the Customize tab.
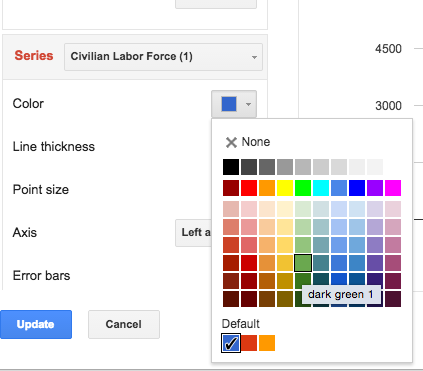
To update the line, bar, or pie colors, scroll down to the Series section, click the drop-down, and change the color.
Embedding the chart
Now that you’ve finished making your design and data adjustments, let’s embed your chart on your website.
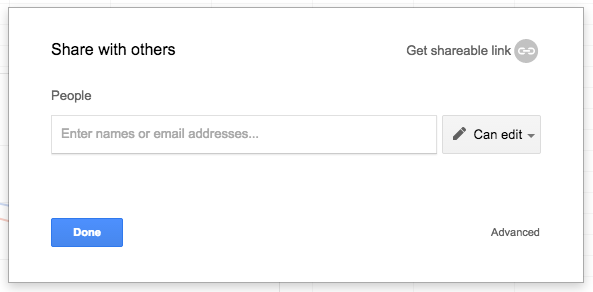
The first thing that you should do is update your share options for this Sheet document.
Click the share button, and select the Advance link.
Click the Change link, and select “On – Public on the web”. This will allow that data to be accessed by anyone (This will be very important when we embed the chart into our website).
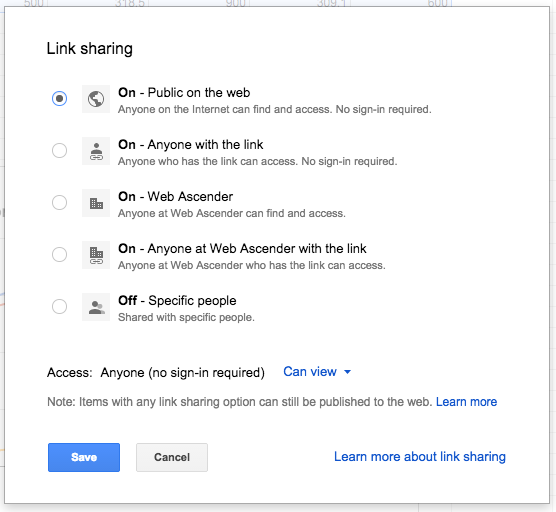
Click Save to make your changes permanent and then click Done.
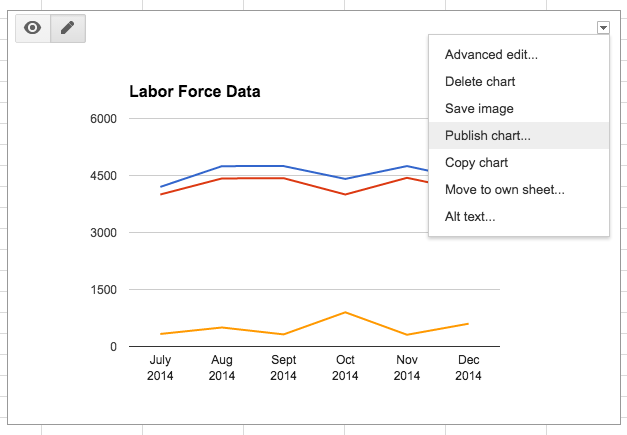
Now, click the down arrow on the right side of the chart, and select Publish Chart.
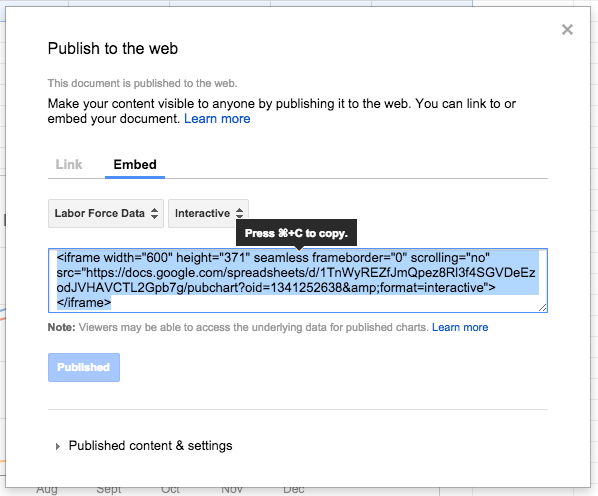
Click the Embed tab, and click the Publish button. You should now see an embeddable iframe code snippet. Copy this iframe code, and navigate to your website.
Paste this code into an HTML/source view, and click save. You should now see your chart load directly within your website.
If, for any reason, you need to update the data within the spreadsheet, your changes will automatically be reflected in your chart. Pretty cool, huh?