I love Chrome’s DevTools package. It provides me with the necessary tools to test and fix bugs within my websites and web applications. I don’t own an Android device but in some cases I find bugs directly connected to it’s browser through the use of an emulator. Wouldn’t it be great to use the same DevTools in this emulated environment?
Today, I’m going to show you how you can easily connect your Chrome DevTools directly to an emulated Android environment and debug live content. This method will work for the browser as well as any other WebView application. Let’s get started. *Note this method will work for Android 4.4 or higher.
Setup your Android Device
I’ve already outlined the steps for creating an emulated environment with my post on Android emulation
Setup Chrome
Visit chrome://inspect in your Chrome web browser.
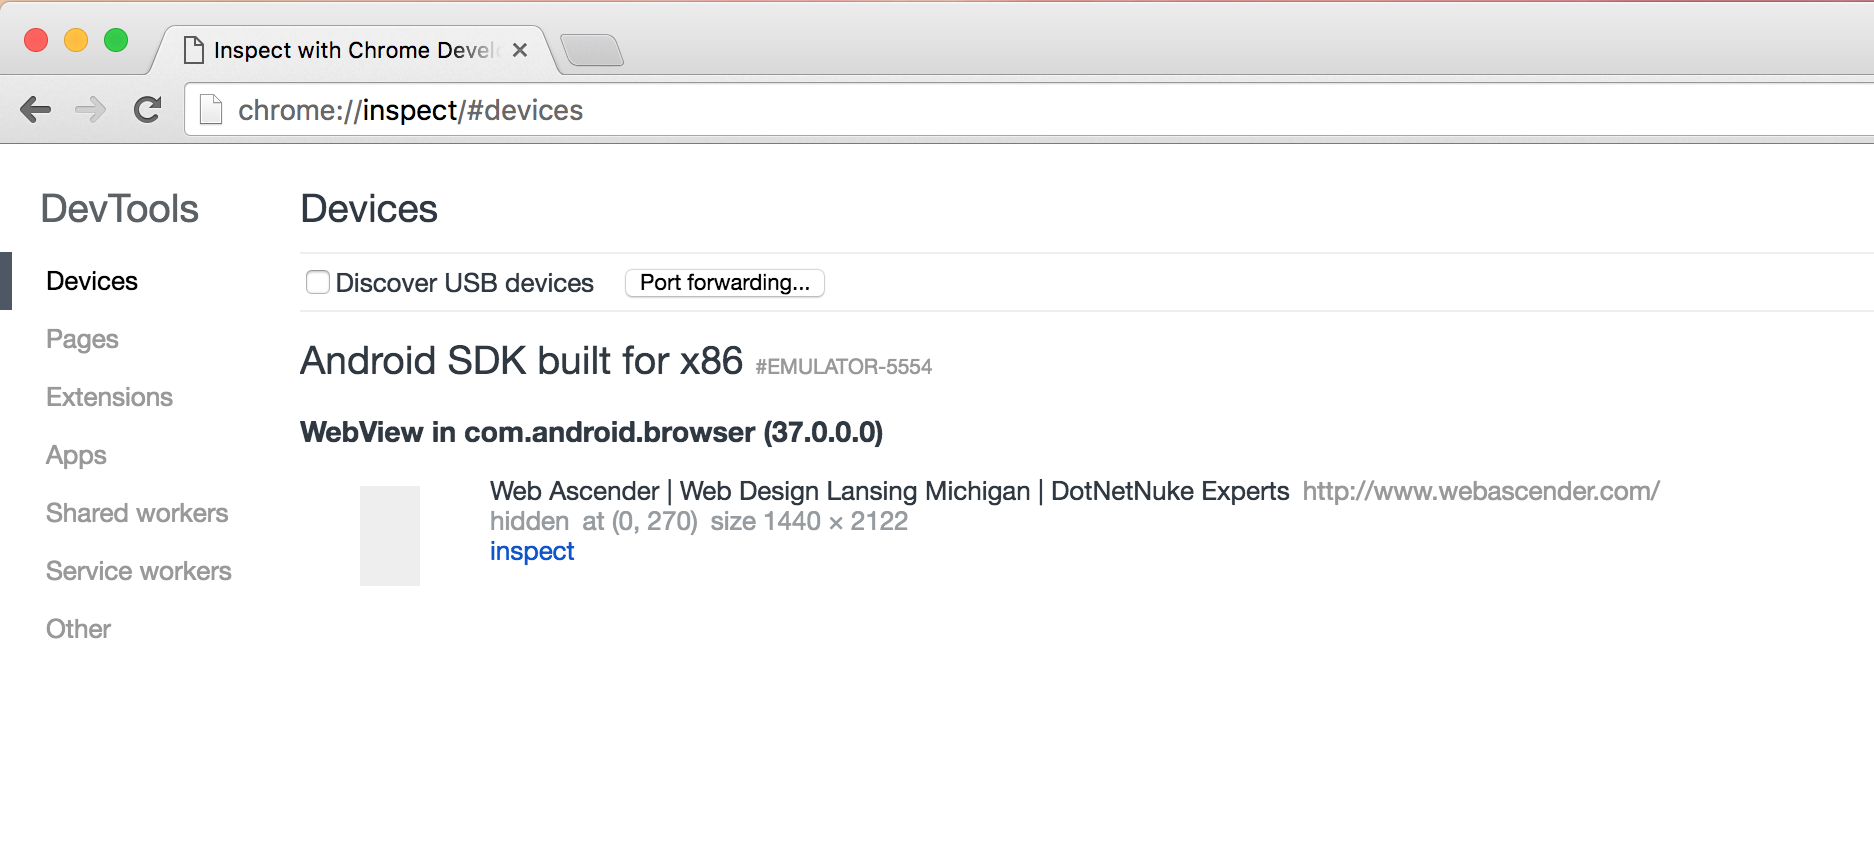
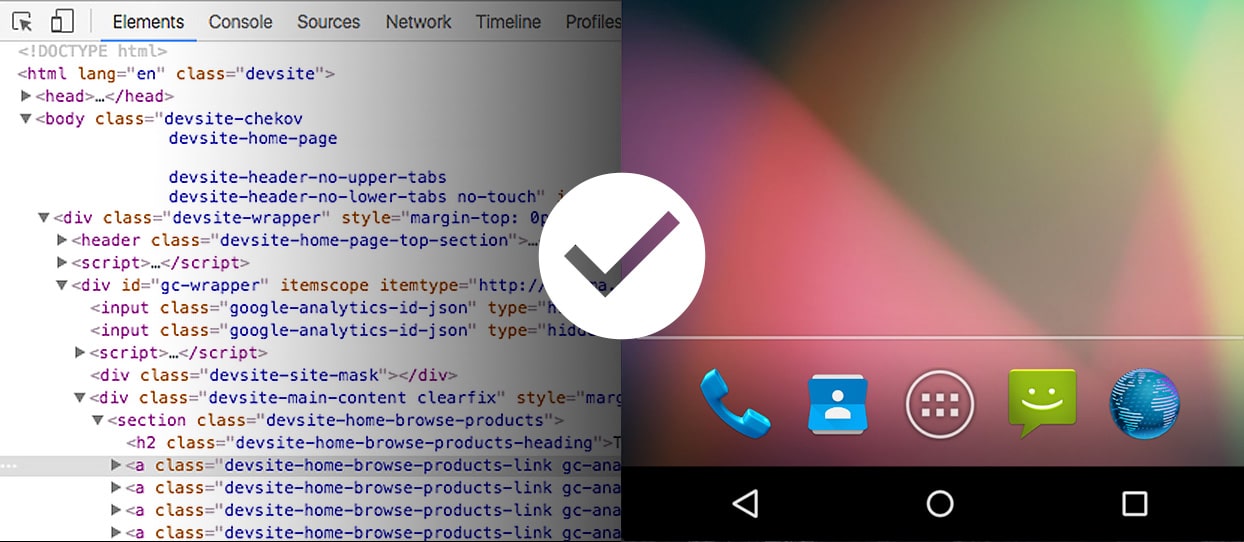
You should see your emulated environment listed under devices. You’ll be presented with some information regarding the current WebView that your are accessing.
Click inspect.
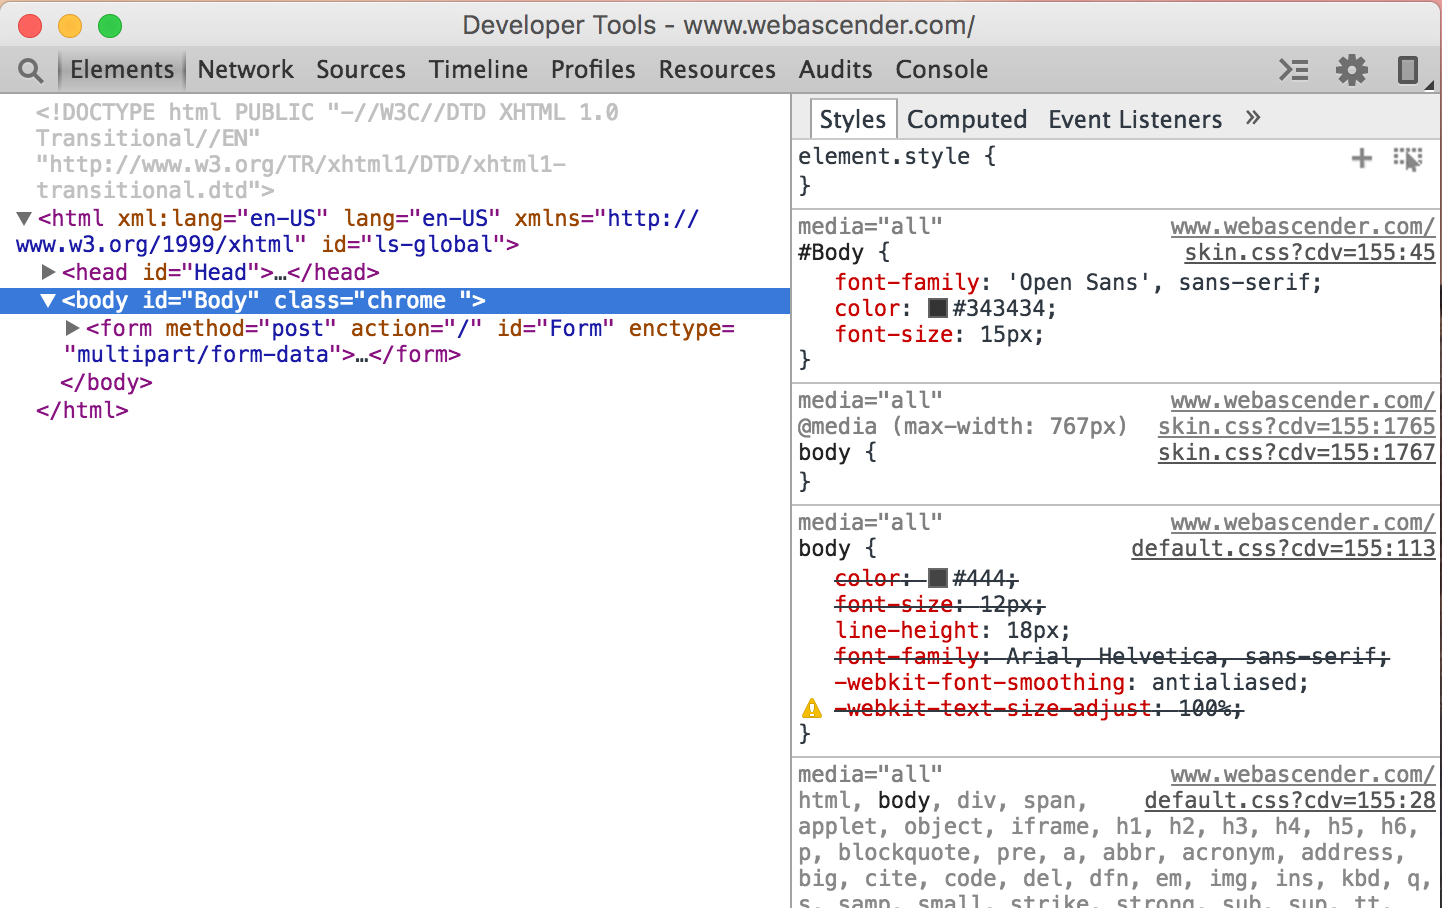
That’s it! You’ll now be presented with the same DevTools window which is tied to your emulated device. Simple, right? You now have full access to your site and can make your adjustments as needed.
