Greenhouse Light Mapping System
A Windows tablet app that reads light and weather sensors across a greenhouse grid, and a web app that turns every reading into heat maps for crop research.
- Client
- Agricultural research company
- Industry
- Agriculture / Research
- Year
- 2017 – 2018
- Discipline
- Web application, Mobile application
Objective: Measure the light plants actually get
An agricultural research company runs trials in greenhouses, where the amount of usable light a plant receives can vary from one end of a bench to the other. To trust their results, researchers needed to know exactly how light was distributed across each growing area, at different heights, and how it changed with the weather.
Measuring it by hand meant clipboards, handheld meters, and spreadsheets. The company asked Web Ascender to turn that into a system: plug sensors into a Windows tablet, walk the greenhouse, and let software do the recording and the analysis.
What Web Ascender Did
- Sensor integration - connected a research-grade light sensor and a compact weather station to the tablet over USB, wrote the low-level serial communication to read them reliably, and validated the readings
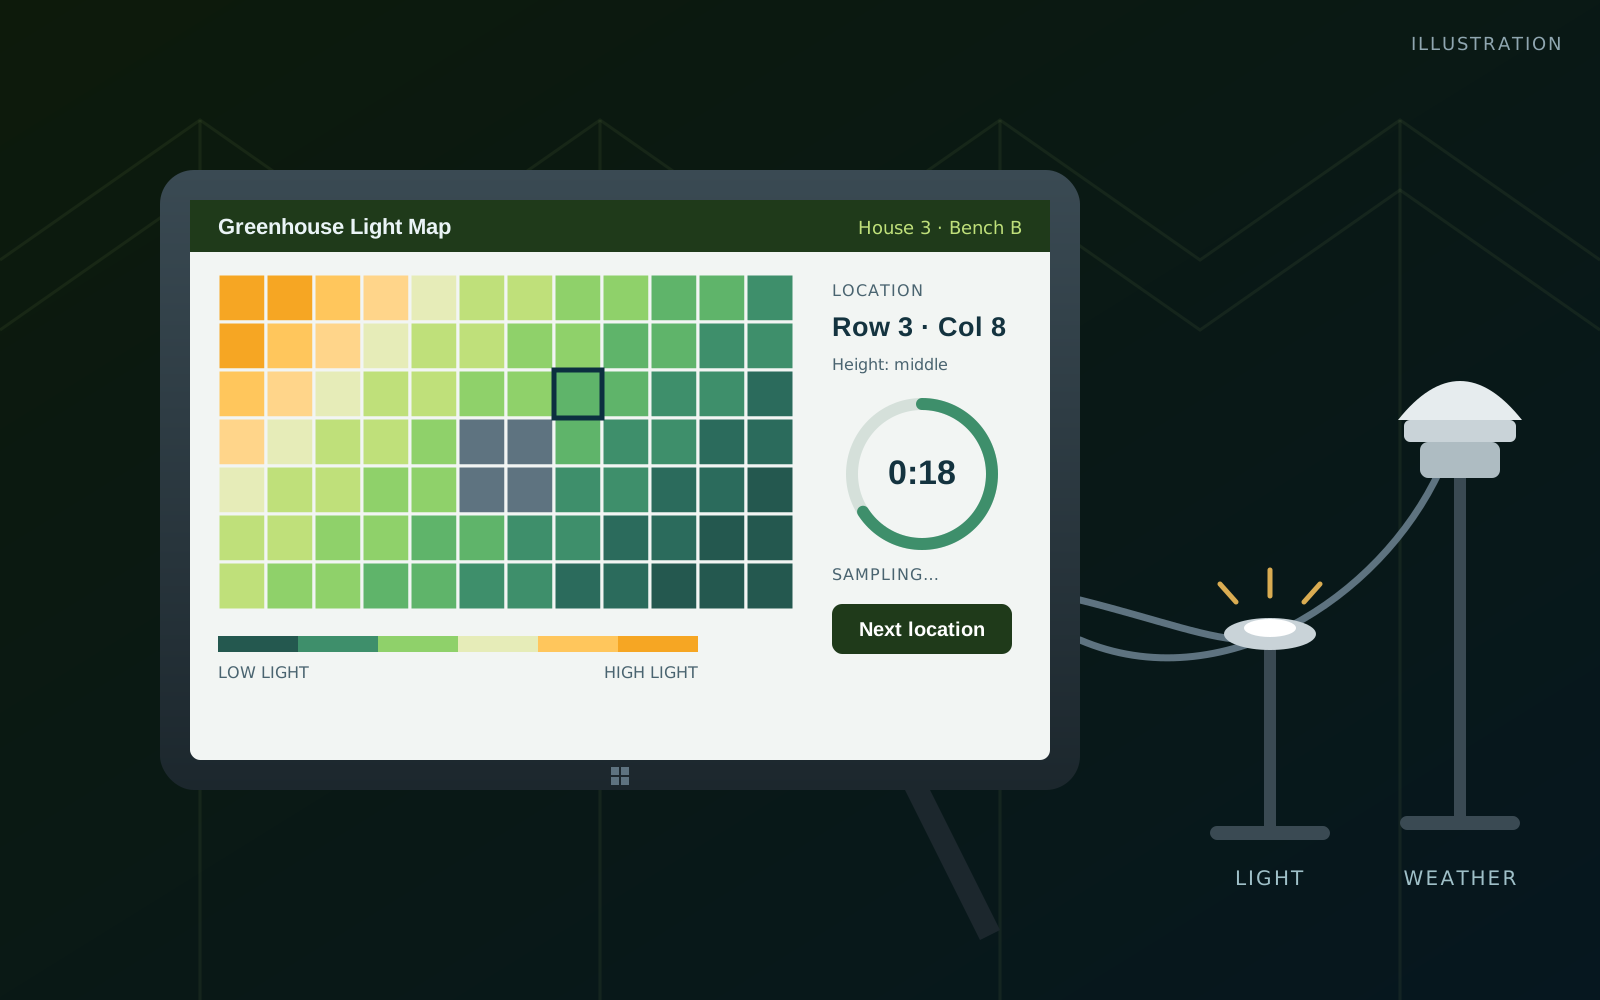
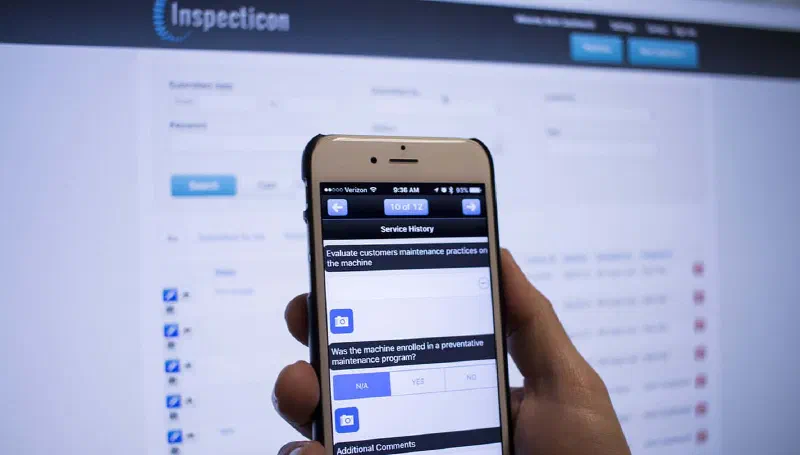
- A Windows tablet field app - shows the greenhouse as a grid, guides the researcher from location to location, runs a timed sampling countdown at each spot, and marks each location as sampled
- Experiments on a grid - facilities, experiments, and grid layouts of any size, including obstructions and top, middle, and bottom sampling heights
- A web application - organizations, users, and roles (including a super admin view across organizations), sample sets with sorting, filtering, and date ranges, and the ability to clone an experiment for the next trial
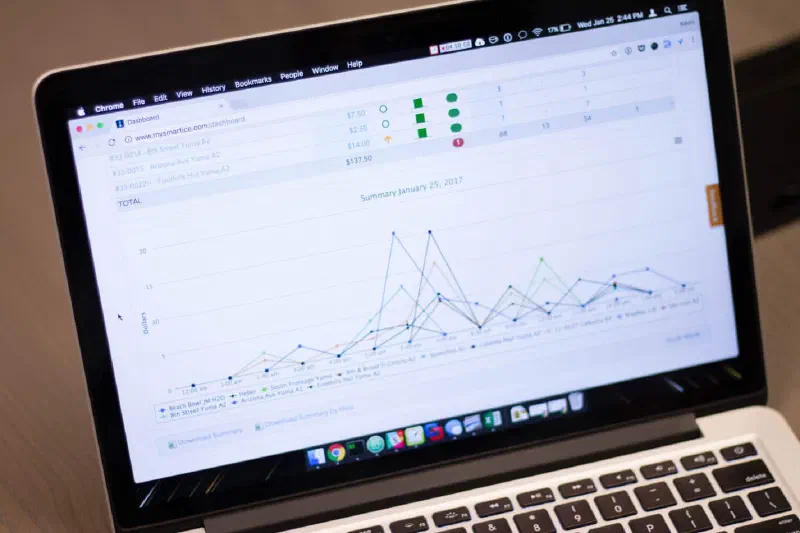
- Heat maps - light readings plotted across the grid with color scaling, plus standard deviation and CSV exports for the research team’s own analysis
- Built for locked-down machines - the field app runs without administrator rights, so it works on managed company devices
- Launch - staging and production servers, SSL, and the field app connected to production
The Outcome
Researchers went from hand-recorded readings to a guided walk through the greenhouse, with every measurement tied to a location and a heat map waiting at the end. The same pattern - sensors, a field device, and a web app that makes the data useful - is the work we do for manufacturers and equipment makers today.
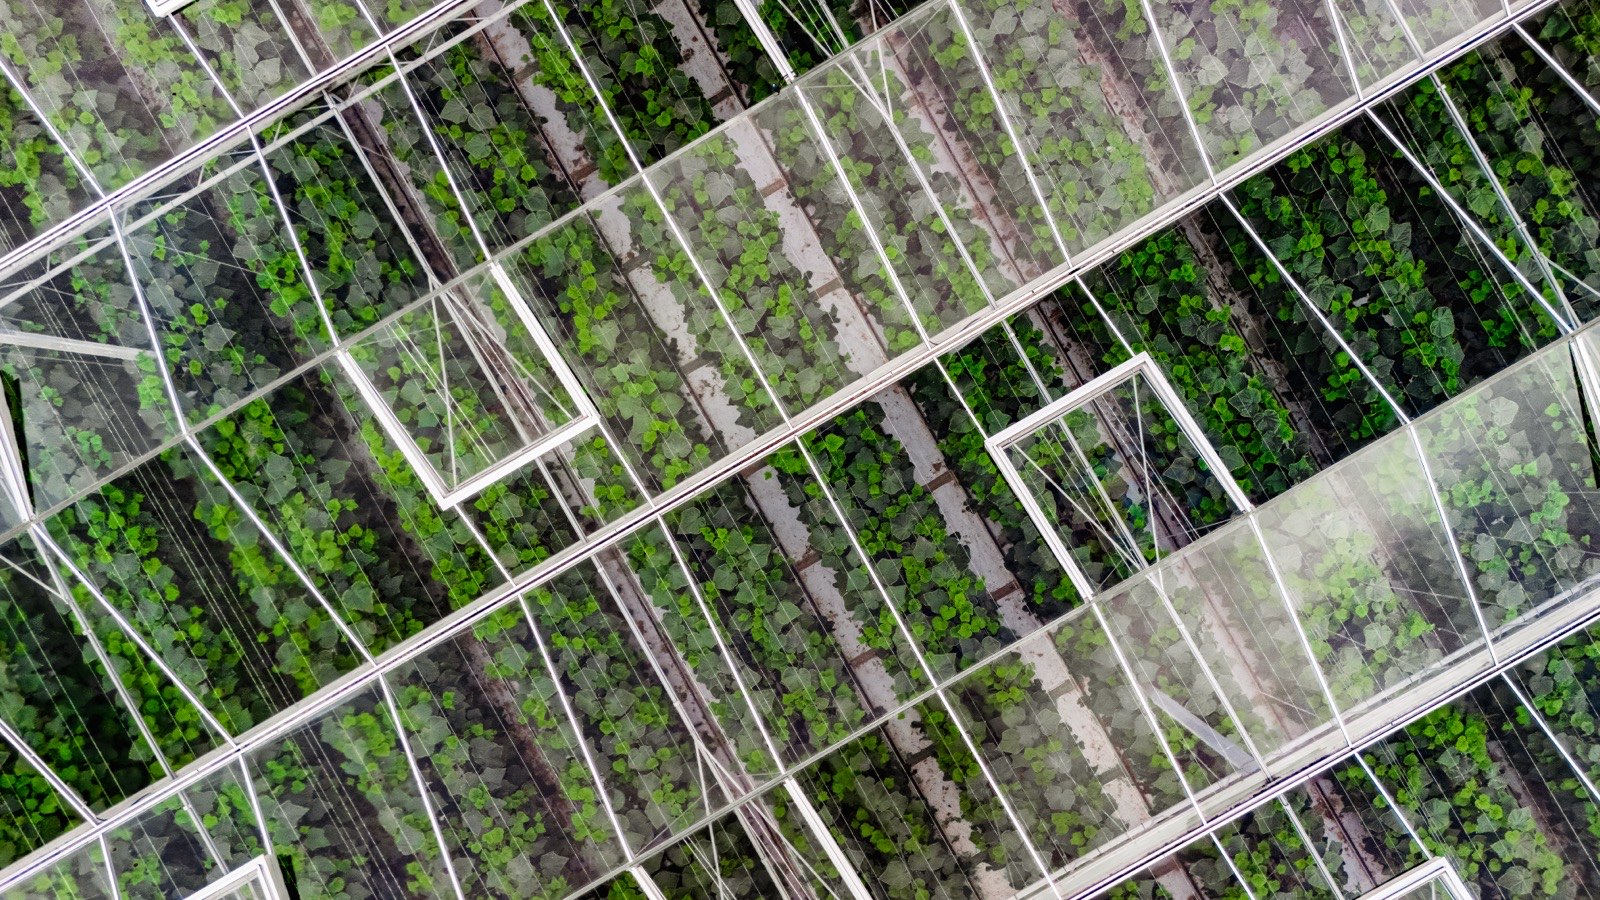
The header photo is representative stock photography and the illustration uses sample data. The client is not named.
What we did
- Sensor Integration
- Windows Tablet Application
- Web Application Development
- Data Visualization
- CSV Reporting
- Hosting & Deployment
By the numbers
Want results like these?
Let's talk about what we could build for your business.
Schedule a call →