Business Intelligence
Know your numbers. We build the dashboards and reports that put your KPIs in front of the people who steer the business.
Every business generates data. Few turn it into decisions. We work with executives to figure out which numbers actually matter, then build the custom dashboards and reports that put those KPIs in front of the right people - accurate, current, and impossible to ignore.
Start with the questions, not the charts
Business intelligence projects fail when they start with a tool and end with fifty dashboards nobody opens. Ours start with the decisions you're trying to make.
-
Ask the questions
We sit down with your leadership team to name the decisions you actually need to make.
-
Define the KPIs
Revenue by segment, quote turnaround, throughput, retention, rep performance: whatever moves your business.
-
Connect the data
We trace each KPI to the systems where its data lives and connect them, so numbers flow automatically.
-
Build the views
Dashboards and reports designed around how your team already meets and works.
-
Make decisions
The numbers show up where decisions get made, and new questions get answered fast.
What we deliver
Because we build and integrate business systems for a living, we can fix the data problems most BI consultants can only point at.
-
KPI discovery and definition
A working session with your executives to agree on the metrics that matter, how they're calculated, and who needs to see them.
Why it matters Everyone argues about the business, not the numbers.
-
Data plumbing
Connecting your ERP, CRM, e-commerce, financial, and operational systems.
Why it matters Numbers flow automatically instead of living in someone's spreadsheet.
-
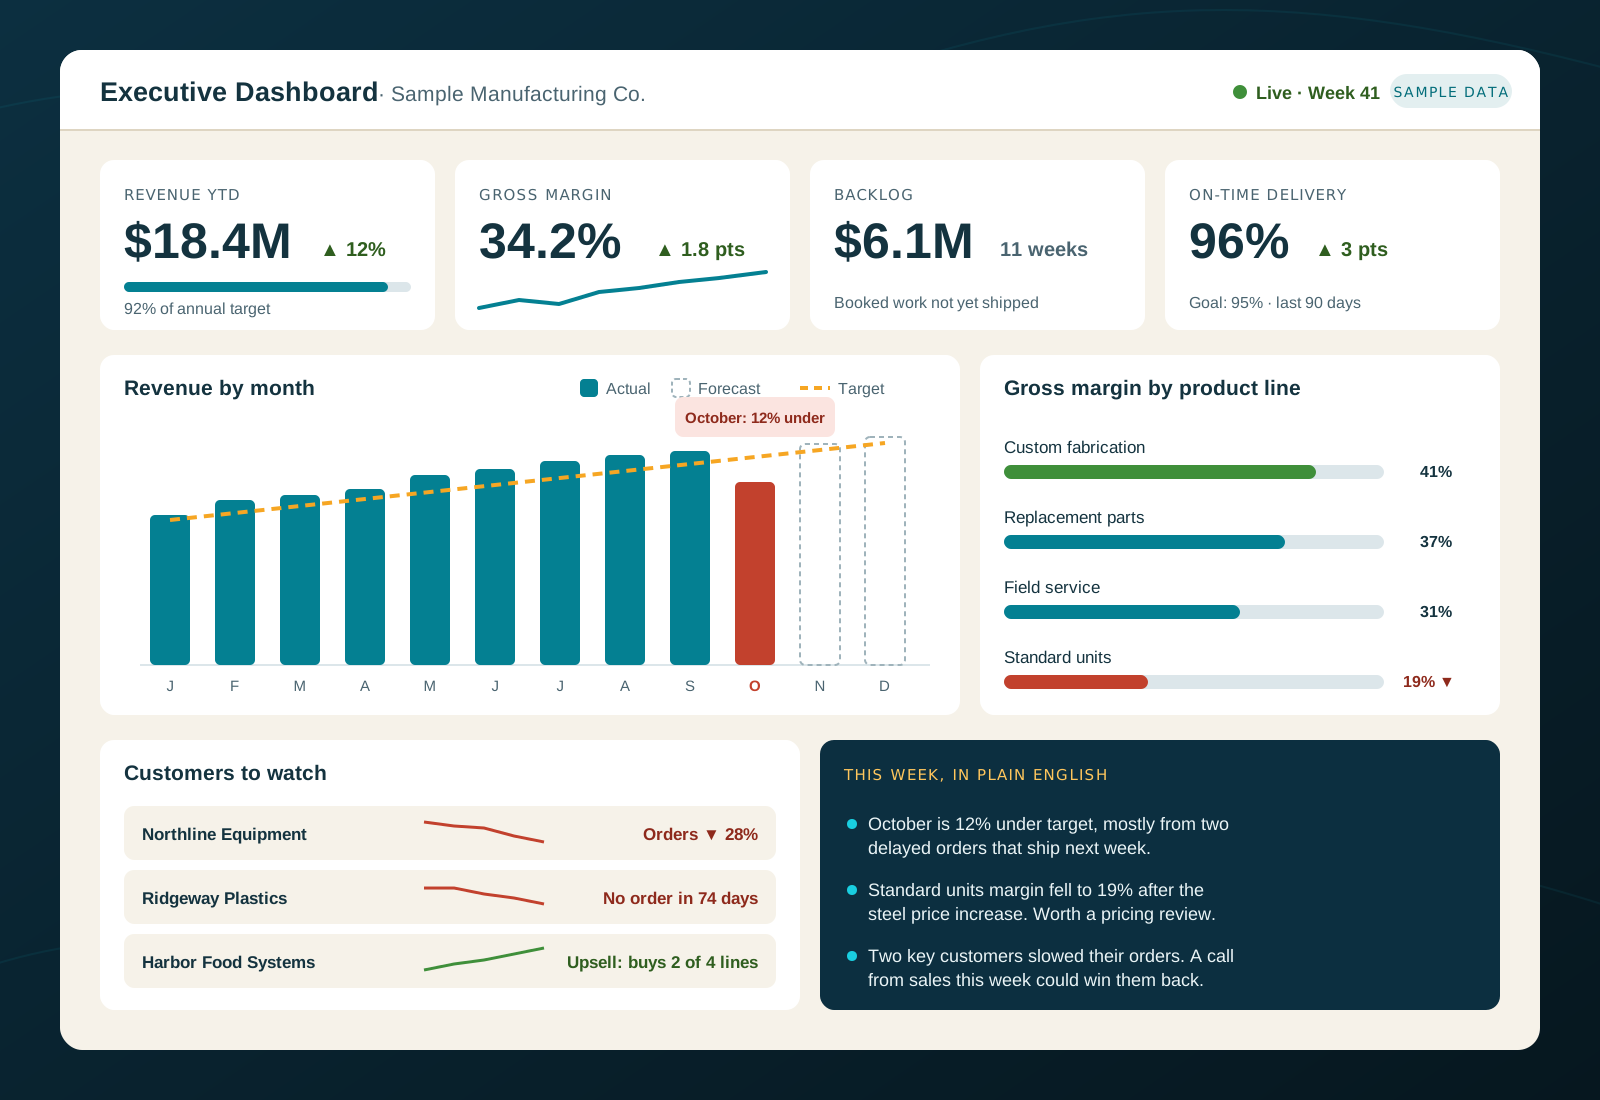
Executive dashboards
Clear, current, custom views of the business for the people steering it, on any device.
Why it matters Leadership sees what's happening now, not last quarter.
-
Operational reports
The recurring reports your managers need, generated and delivered automatically.
Why it matters The Monday meeting starts with answers.
-
Ad hoc reporting
When a new question comes up, you get an answer quickly.
Why it matters Hours, not a quarter-long BI project.
-
Fixing the data at the source
We build and integrate business systems, so we fix bad data where it starts.
Why it matters Dashboards you can trust, because the data underneath is right.
Dashboards your team will actually use
The best report is the one that ends an argument. We design dashboards around how your team already works, the Monday meeting, the monthly board deck, the daily production huddle, so the numbers show up where decisions get made.
If you’re running your business on exported spreadsheets and gut feel, a discovery call is a good first step. We’ll tell you what’s realistic, what it takes, and where to start.
Ready to grow?
A 30-minute discovery call tells you if we're a fit - and what it would cost.
Get Started →or call 517-455-7837
The Executive Guide to Digital Domination
The exact strategy and tactics we deploy to grow our clients - free to download.
Get the Guide →