
When tracking the success of your website, it’s important to understand what website metrics to track each month for comparison. In order to improve your website to increase website traffic, leads and sales over time, focus on moving these website metrics in a positive direction.
10 Website Metrics to Track to Improve Your Website
Here are a few key website metrics that can give you the insight you need to make impactful decisions on what website updates to make and content to create.
1. Direct Contacts
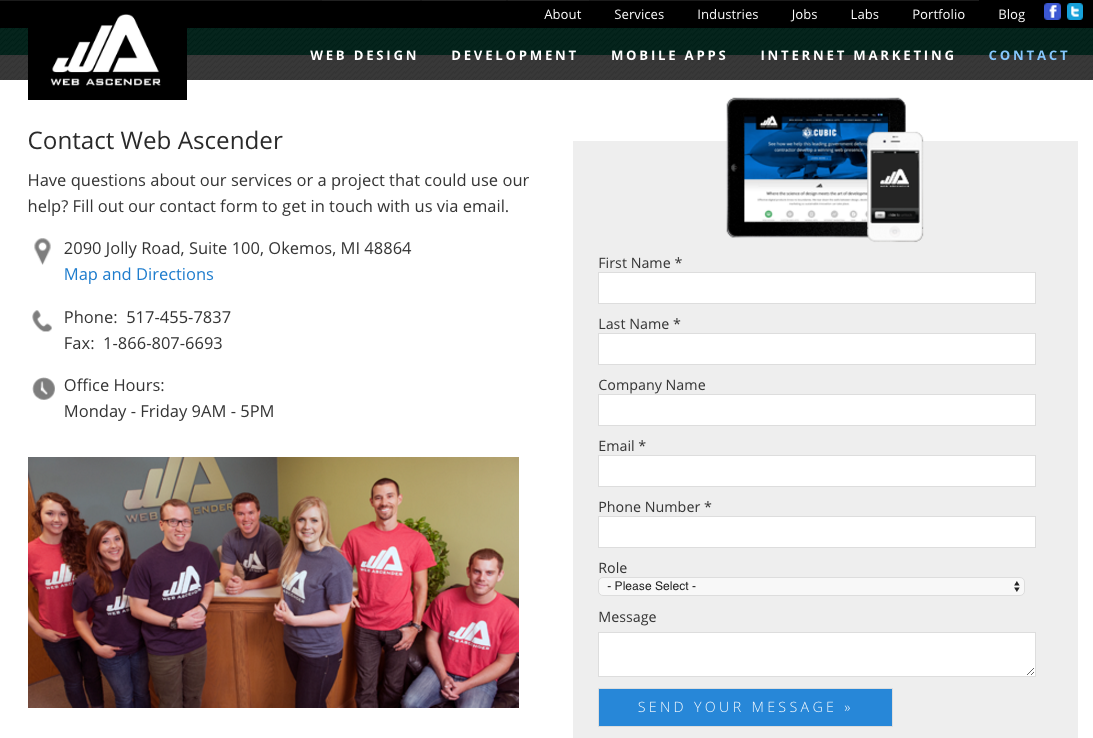
The first website metric to track to improve your website is the number of direct contacts you receive monthly. These are leads that directly connect with your business using contact forms on your website or contact information listed. These are strong leads because they typically have a direct request and will not take much nurturing to move through the sales cycle. Monitoring your direct contacts will give you insights about how to improve your website because it will help you understand if your web pages and contact information is readily available and simple enough for leads to fill out.
How to track this website metric:
If you have a contact form on your website, you should check form submissions from the back end of your site by selecting the form, selecting “submissions” or “entries” and filtering by the current date range. Typically because they are direct you will also be able to track these through emails and phone calls throughout the month as well.
2. Marketing Qualified Leads
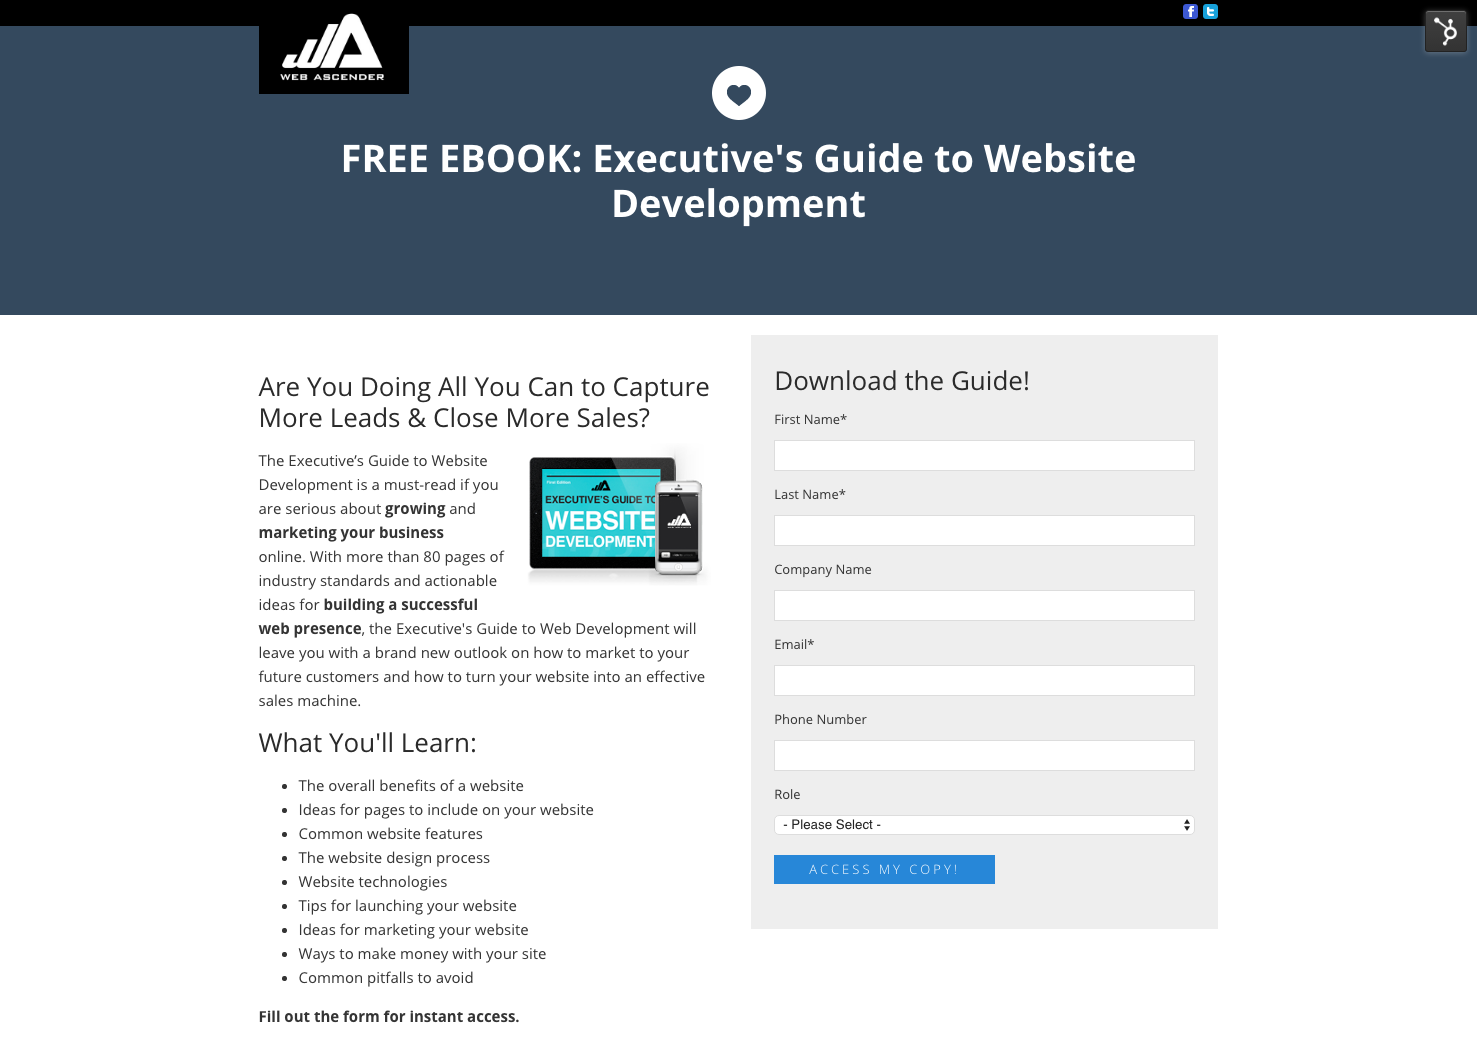
Aside from contact leads you will also receive marketing qualified leads. This is an important website metric to track because it will show you the effectiveness of the marketing content you’ve provided on your website. When creating marketing content to target each of your target audiences you’ll want to create proper landing pages, forms, thank you pages and lead nurturing emails to move leads through the sales cycle. Tracking marketing content leads will help you understand what elements of your marketing content are effective and where you should post the content to improve your website.
How to track this website metric:
Each of your pieces of marketing content should have a form as a barrier. This barrier is how you collect contact information from potential leads. To track your marketing qualified leads you will access the form entries for each month so see what contacts originated from marketing content on your website.
3. Monthly Sales
Once you’ve compiled a comprehensive list of contact leads and marketing leads another website metric to track should be your monthly sales or new customers. Tracking your overall monthly sales and comparing them to your lists of leads will help you better understand where those sales originated. Depending on your sales cycle you might not be able to see a direct correlation between leads and sales right away. However tracking this metric long term can help you learn the behavior of your customers and improve your website performance over time.
4. Organic Traffic
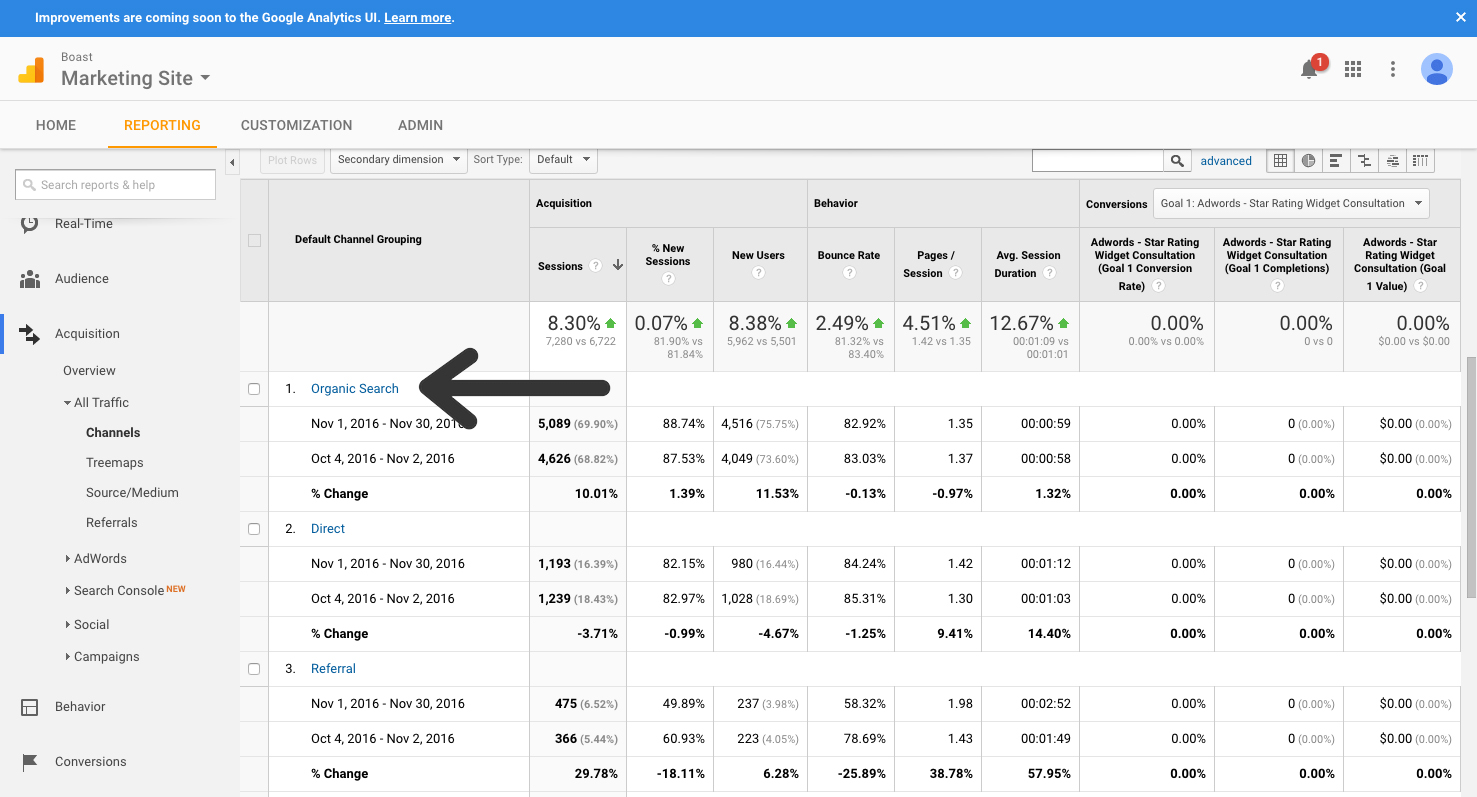
Another website metric to track to improve your website is organic traffic. Organic traffic is traffic that lands on your website organically through search. This means that a visitor has searched a specific keyword, and content from your site has matched and showed up in search results. One way to directly increase organic traffic is blogging. Creating a business blog allows you to attract visitors to your website with specific keywords that may not be directly referenced from a page on your site. Monitoring your organic traffic will allow you to analyze what content on your website is bringing in the greatest number of visitors from search engines, and how you can continue to improve your content and landing pages to rank higher for relevant searches. Once you gather your monthly organic traffic landing pages, take it a step further and analyze how many leads were generated from CTAs on that page. This will allow you to see how your organic traffic is converting to leads.
Learn how blogging increased Dater Dentistry’s organic traffic by 600% »
How to track this website metric:
To find organic traffic in Google Analytics, you’ll first select the date range you’d like to view. Then you’ll select “Acquisition”, “All Traffic”, and then “Channels”. From there you will see the traffic split up into channels. Select “Organic search”, and from there you can toggle between the top organic keywords and landing pages that were primarily visited organically.
5. Paid Traffic
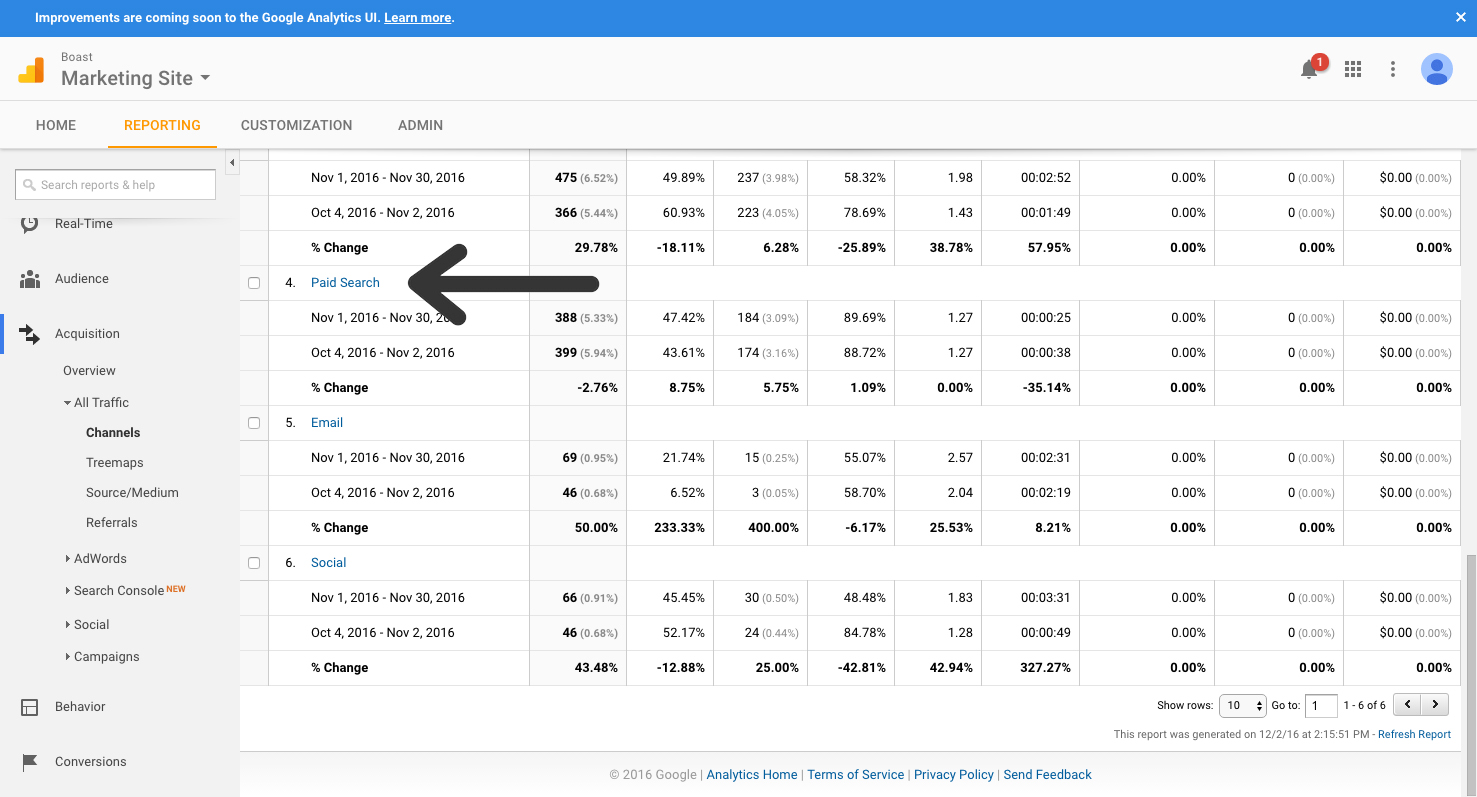
Paid traffic shows traffic that comes from paid search ads. This website metric will give you insights into whether or not your Adwords copy, remarketing ads and display banner ads are effective at bringing in visitors to your landing pages. Breaking down this traffic source by landing page will allow you to review which keywords and landing pages are performing the best and which you need to re-evaluate. There are a few things you should look at within paid search including a landing page’s bounce rate and conversion rate. For example if your landing page has a high bounce rate, it could mean that visitors aren’t landing on the content they’re expecting to based on your ad copy. If your landing page has a ton of visitors but the form on that page isn’t generating leads it could lead you to the same conclusion. Monitoring your paid traffic website metrics will help you understand what ads work at bringing visitors to your website.
How to track this website metric:
To find paid traffic in Google Analytics, you’ll first select the date range you’d like to view. Then you’ll select “Acquisition”, “All Traffic”, and then “Channels”. From there you will see the traffic split up into channels. Select “Paid search”, and from there you can see the top paid search landing pages that are performing best.
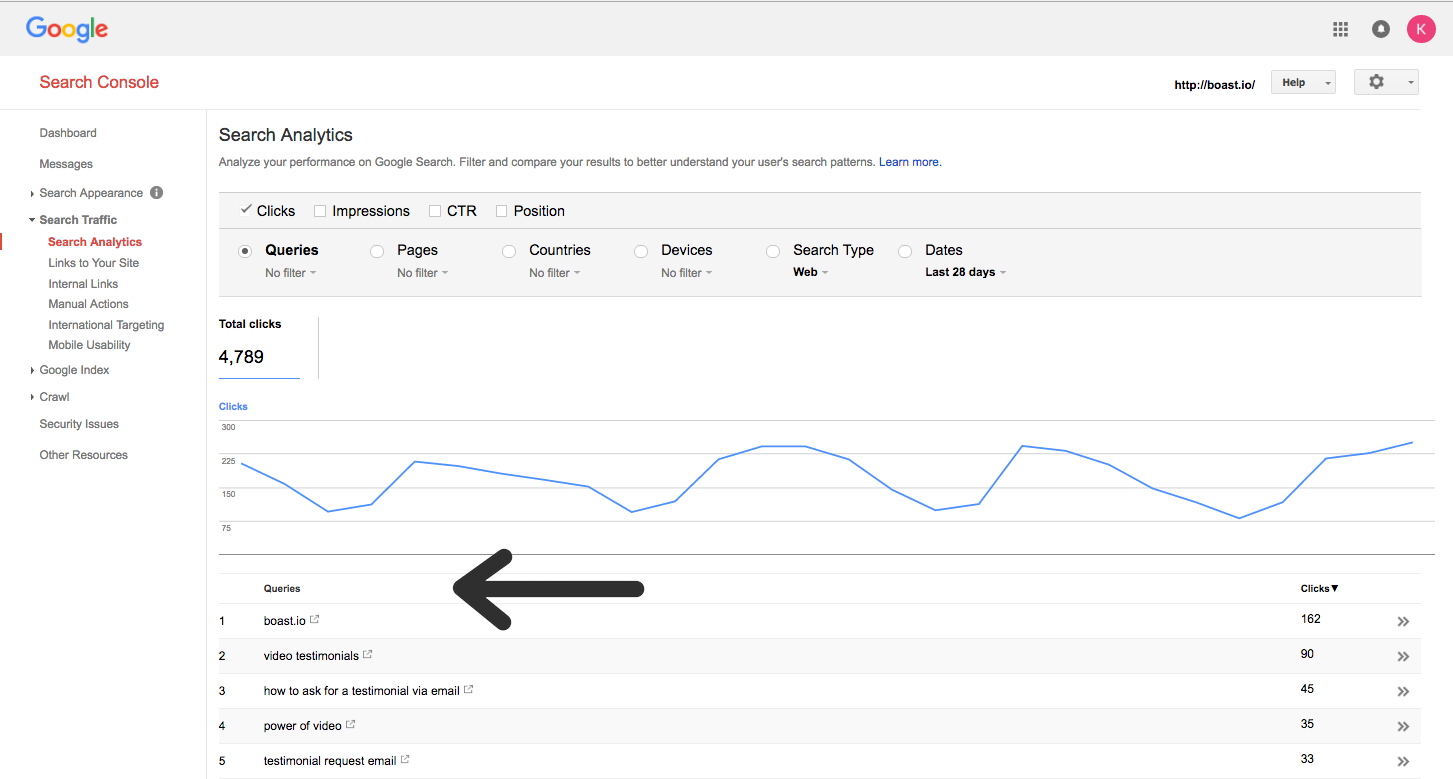
6. Top Keywords
Tracking top keywords is an integral part to increasing traffic to your website. Using Google’s webmaster tools to track this website metric allows you to narrow down the top keywords that are leading to increased visitors and conversions on your website. You can narrow this down even further by filtering through specific related areas of your website, like your blog for example, and finding out what keywords lead to blog traffic. This will allow you to improve your website by seeing what keywords are your strongest converters, and what keywords you’d like to rank for to set goals for improvements.
Learn how to use the Google Adwords keyword planner tool to improve this website metric »
How to track this website metric:
To find your top keywords you can use Google WebMaster Tools. Select the “Search Traffic” dropdown, then select “Search Analytics”. From there you can select the date range you’d like to view. Once you set the date range you’ll be able to view your top keywords that brought traffic to your website during that period. You can see how many clicks, impressions, the CTR and the position in the search query of these keywords. You can also filter your data by URL to see what keywords lead to different areas of your site – for example blog posts, and services pages are good to compare.
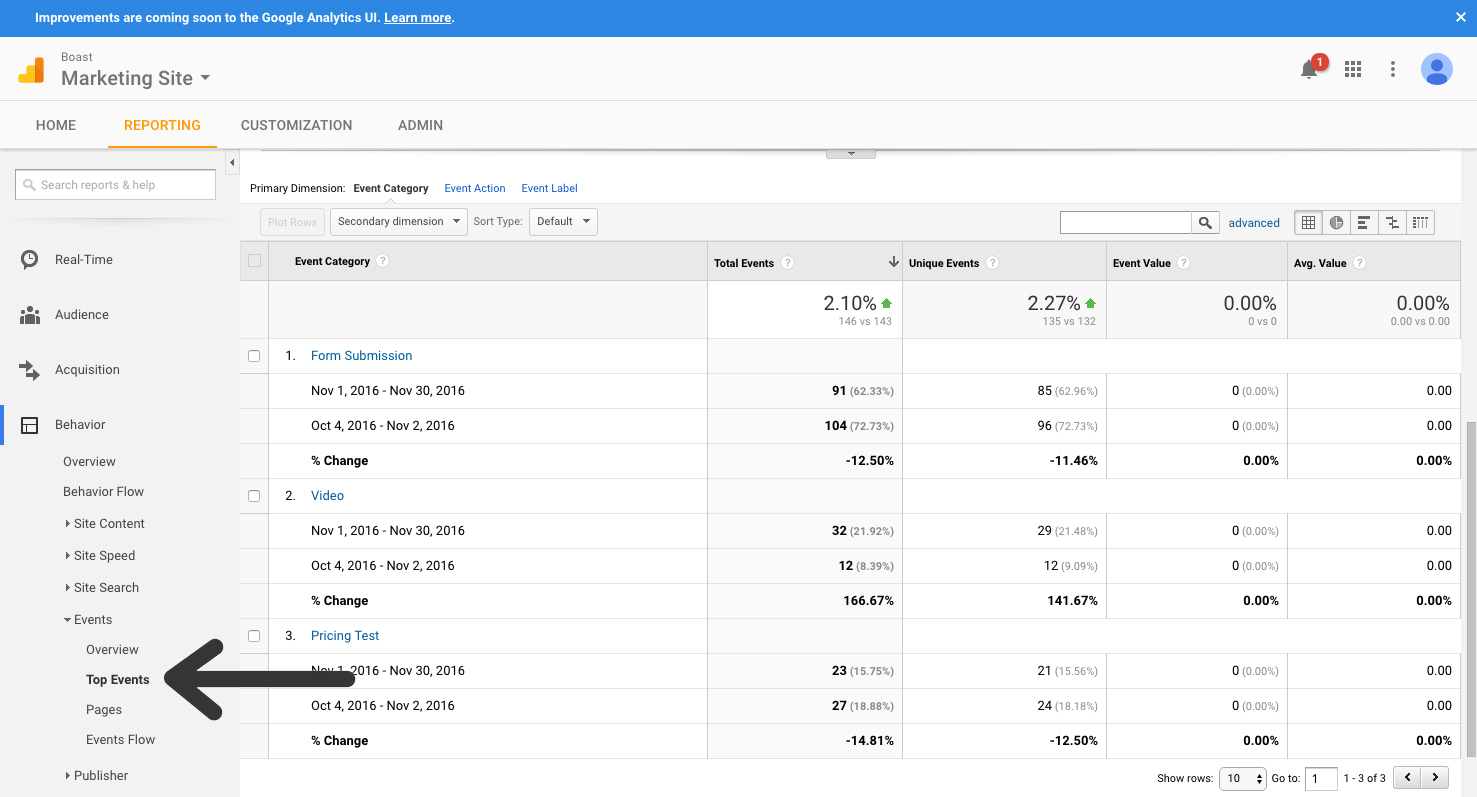
7. Events & Event Actions
In Google Analytics you can set up events to track whether or not certain actions are taking place. For example if you have a specific CTA on a page, setting up an event to track when a visitor fills out your CTA will allow you to better understand how and where visitors are converting on your website. Tracking this website metric allows you to compare different events on your website all in one place to get insights on what changes to make to improve your website.
How to track this website metric:
You’ll first need to set up event tracking in Google Analytics to track this website metric. To do so you will login to Google Analytics, select Admin, select goals, and create a new goal. From there you will select from the available templates or choose custom. Then you’ll name your goal, and select event. From there you will set your conditions for the action that the user takes that you’re trying to track. Once this is created an event tracking code will be generated and you’ll need to place this on the back end of the web page that has the event you’re trying to track. To find events and event actions in Google Analytics, you’ll first select the date range you’d like to view. Then you’ll select “Behavior”, “Events”, and then “Top Events” or “Pages”. From there you will see different events based on the event track you’ve set up, and various landing pages that commonly convert.
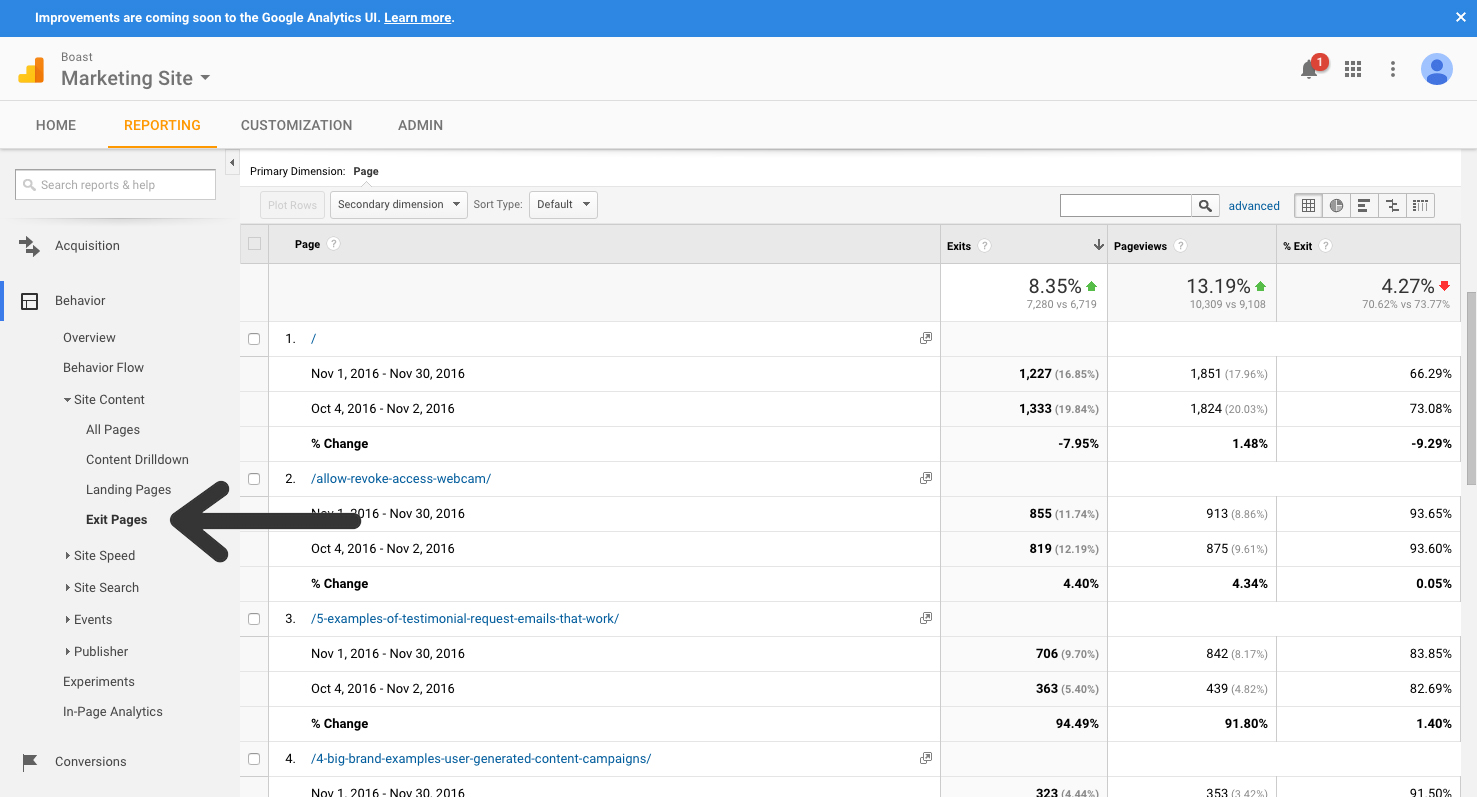
8. Exit Rate
Many people get the bounce rate and exit rate confused when analyzing their website’s performance. These are both important website metrics to track to get insights on pages on your website that need work. An exit rate, or exit pages, are pages that are consistently the last page a visitor of your website is on before exiting out of your website. Analyzing this metric will help you identify landing pages or general pages on your website with a high exit rate, allowing you to make necessary updates to keep visitors on your website for longer.
How to track this website metric:
To find the exit rate in Google Analytics, you’ll first select the date range you’d like to view. Then you’ll select “Behavior”, “Site Content”, and then “Exit Pages”. From there you will see pages that are commonly exit pages. You can see how many website visitors exited on that page. You can also add the secondary dimension “Default Channel Grouping” to see how visitors landed on these exit pages.
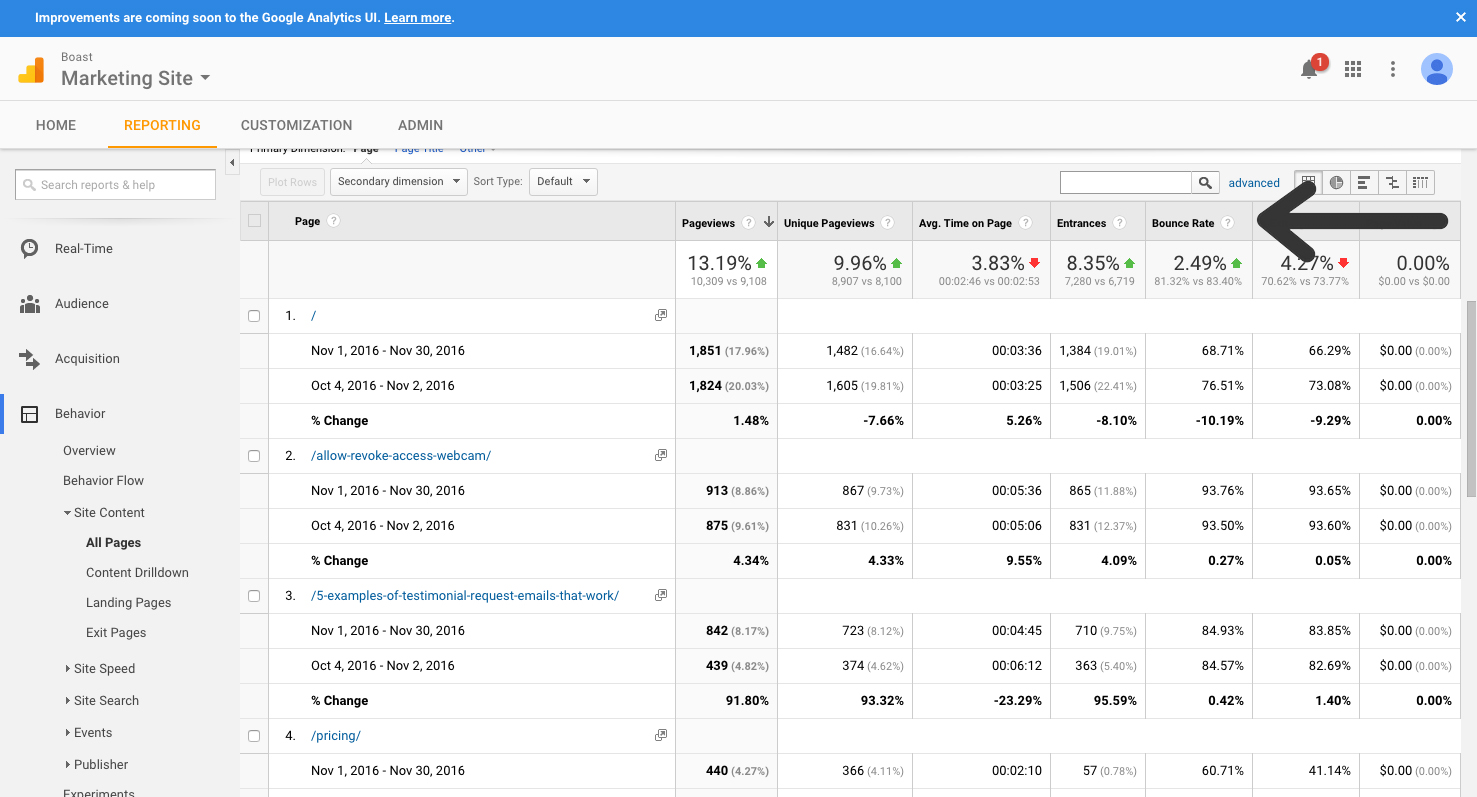
9. Bounce Rate
Another key metric to pay attention to is the bounce rate. A bounce is when a visitor who lands on your website immediately clicks the back button or exits out of the browser. This is an important website metrics to track because an increased bounce rate could mean that visitors aren’t landing on what they’re expecting. It’s helpful to look at the overall bounce rate of your website, but looking a little deeper into the bounce rate by looking at specific traffic sources and pages will help you gather more information about what’s causing visitors to bounce. For example if you notice that a specific landing page on your website has an increasingly high bounce rate, it could be time to rework the content on that page so that visitors are landing on what they’re expecting to land on.
How to track this website metric:
To find bounce rate in Google Analytics, you’ll first select the date range you’d like to view. Then you’ll select “Acquisition”, “All Traffic”, and then “Channels” to view the bounce rate by channel. Or you can select “Behavior”, “Site Content” and “All Pages” to view the bounce rate by pages. In either of these views you will see the bounce rate for each section. By comparing date ranges you can view how your bounce rate for these areas has changed over time.
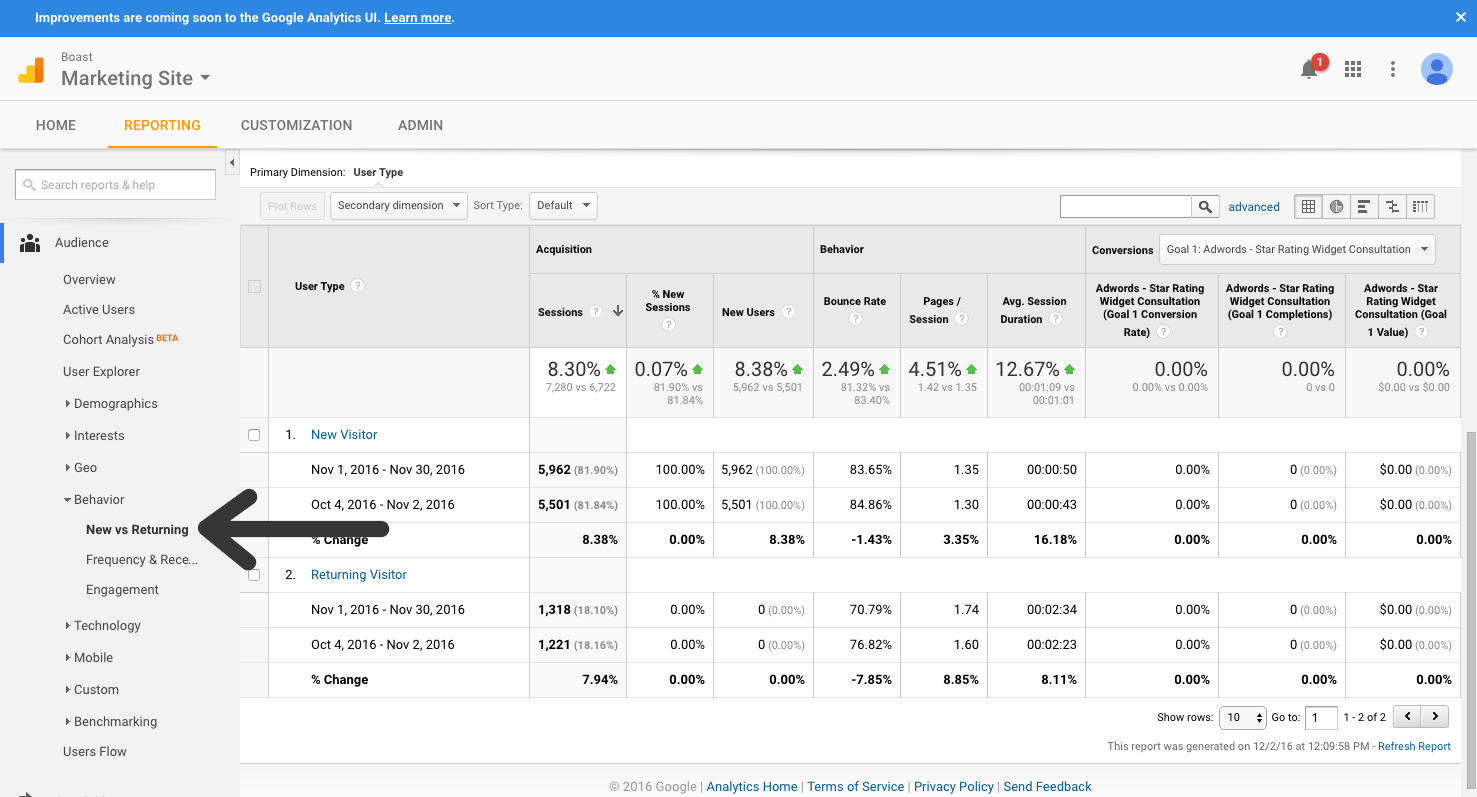
10. New vs. Returning Visitors
Another website metric to track to improve your website performance is new vs. returning visitors. An increase in new visitors will give you insights about new content that you’ve published. Maybe you’ve ranked for a new keyword that taps into a different part of your target audience. Returning visitors will give you insights into visitors that are returning to your website time and time again, which will help you narrow down what pages and content are producing repeat visitors.
How to track this website metric:
To find bounce rate in Google Analytics, you’ll first select the date range you’d like to view. Then you’ll select “Audience”, “Behavior”, and then “New vs. Returning” to view your visitors broken up by new visitors and returning visitors for that time period. You can then add secondary dimensions to view this information broken down. For example you can add “Landing Page” as your secondary dimension to see what landing pages have the highest number of new visitors and returning visitors.
You can compile a massive variety of information by simply analyzing your leads, sales and using google tools to analyze traffic. However, not all information directly helps you improve your website performance. Taking time to analyze these 10 website metrics each month will help you make better decisions on what content to create, and what website improvements to make to increase leads. Over time you can then make decisions based on factual metrics rather than guessing what you think your audience will be influenced by.